Experimental Hub
Python
TypeScript
React
WebRTC
Chart.Js
Custom web conferencing platform specifically designed for research with filters, featuring a comprehensive filter framework. Can be used to conduct online experiments. I developed the backend and networking architecture as part of my bachelors thesis.
Background
We are able to observe a rise of filters in consumer applications, such as Snapchat, Instagram or
conferencing platforms like Zoom and Microsoft Teams. These filters are often used for entertainment or
to enhance privacy, e.g. virtual background filters. However we also see more of their negative impacts
on society. Especially face filters impact beauty standards and emotions. They can also cause
self-discrepancy and body dysmorphia and the use of face filters was linked to an increase in acceptance
of cosmetic surgery.
With this in mind, filters are an increasingly interesting topic for researchers. However, researching
filters using existing platforms can come with privacy concerns and a lot of limitations, in part
because existing platforms are not designed for researchers. Researchers are either unable or extremely
limited in their ability to implement custom filters. For example, should a custom filter include some
kind of real time analysis or machine learning algorithm, that would be likely impossible within a
existing platform. Another problem researchers can face is control over participants. Existing
applications leave every user in control over what filters are enabled and how they might be configured.
While this is good in there intended use, it can be a problem when a researcher needs a participant to
change a filter mid experiment. Especially should the participant not be aware of how to do that, e.g.
due to limited technical knowledge.
Custom Conferencing Platform
To solve the problems outlined above, I developed a custom conferencing platform. This platform was specifically
designed for researchers in order to address the challenges they face when conducting research with filters using
existing applications. The platform has a web frontend to allow participants to join without any additional
installation (accessibility). Researchers are in full control over collected data and participants, allowing them to
change, edit and apply filters without any input from participants. In addition, the platform features a
comprehensive filter framework, which allows the implementation of custom filters without any arbitrary limitations.
This includes the ability to use filters for real time analysis, include machine learning algorithms and much more.
Design
The platform differentiates between two user types, experimenters and participants. In order to connect to the
server, the client provides a user type and corresponding authentication. Experimenters must provide a password,
while participants use a session ID and participant ID to authenticate themselves. Users then have access to two
different APIs, depending on their user type. Besides the different user types and APIs, the server also stores a
list of planned sessions. Theses sessions are created by experimenters in a form page and send to the server using
the experimenter API.


Conferencing Platform Design
Experimenters see a list of all planned sessions on their landing page, with the ability to edit, copy, delete or
create new sessions. The sessions have a variety of attributes, like a title, description and
date, but most importantly they have a list of invited participants ("Participants Data"). This
list contains the name and state of all participants within a session, including active filters and their configuration.
When it is time to conduct the actual experiment, a experimenter selects one of the sessions and starts it. This creates
an Experiment on the server, which users can then connect to.
User Flow
The following image shows the intended user flow. In preparation for an experiment, experimenters can manage
sessions and start a session in order to create an experiment. Only after a experiment has been started can the
invited participants join. Initially the experiment is in a waiting state. Participants join a waiting room, prepare
their camera and can chat with the experimenter. Only the experimenter already sees all participants. During this
phase, the Experimenter can e.g. take notes, adjust filters and communicate with participants, should for example
adjustments to their webcam setup be required. When the experiment is started by the experimenters, participants
join the experiment room and are able to see each other.


Filter Framework
In order to allow researchers and developers to develop their own custom filters, the platform features a
comprehensive filter framework. To ensure compatibility with any filter idea or concept, I conducted a literature
analysis and created a list of filter concepts. This list was extended with filter concepts from existing
applications and brainstormed ideas. The concepts were then categorized into analysis, manipulation, both or other
and sorted regarding the number of involved participants and expected computational complexity.
- Manipulation: Filters that modify a track. For example a cartoon effect filter that changes the general appearance of a video track.
- Analysis: Filters that analyze a track. For example a face detection filter.
- Manipulation and Analysis: Filters that analyze and modify a track. For example a virtual background filter, that detects a person and replaces everything expect that person with an static image.
- Other: Filters that neither analyze or modify a track. For example a recorder that records a track.


Filter Pipeline
The filter pipeline executes the filters on a track. Each frame received by the server passes trough it and each
user and track (audio/video) has its own pipeline. In essence, the pipeline executes the filters sequentially and
uses the output of one filter as the input for the next one. Therefore the order in which filters are configured can
make a difference. However tracks can also be muted by the experimenter. In that case, a special mute filter is used
to get a still image or silent audio frame, depending on the track type. If muted, "normal" filters are
not executed by default. Filters can however be executed even if muted by setting the run_if_muted flag. This
can be used to ensure that analysis filters are always executed.


Networking
In order to provide a low latency, high quality video and audio experience the platform is build using WebRCT.
WebRCT is a open source, standardized solution that is built upon existing and proven standards. It is built into
modern browsers and accessible via a JavaScript API. In essence, it allows websites to access webcams, microphones
and screen recorders. Most importantly, it can be used to build connections to other peers, which can be other
browsers or servers.
For the networking architecture, I compared three common approaches for WebRTC which can be seen bellow. The first
approach is a peer to peer (P2P) based approach. P2P has its advantages and is supported by WebRTC, only requiring a
signaling server to build, but not to maintain, a P2P connection. However a P2P approach would mean that clients
need to run the computationally intensive filters, which would increase the requirements for participants.
Additionally, a P2P approach lacks any central authority that can remove misbehaving users, including possible
attackers, and manages the potentially sensitive user data.
The Multipoint Control Unit (MCU) approach introduces a server, which all clients connect to directly. The server
acts as a central authority and can run the computationally intensive filters. It merges incoming streams and
distributes the merged stream. However this merging process takes up additional resources, limits the clients user
interface (UI) in the the way the streams of other users can be displayed and can be more difficult to debug.
The Selective Forwarding Unit (SFU) approach is similar to the MCU, featuring all the above benefits but distributes
streams individually instead of merging them on the server. This allows the UI full freedom in how a stream is
displayed and avoids unnecessary computational costs for the server.


Testing
Both Google Chrome and Firefox provide a dedicated page for analyzing and debugging WebRCT connections
(chrome://webrtc-internals and about:webrtc). They show statistics and logs for all connections that
currently exist within the browser instance. While they can be very helpful in low level connection debugging, they do
not allow you to interact with the connection and can not measure more enhanced statistics such as the end-to-end video
latency or message round trip time. To fill this gap I developed two testing tools as part of the frontend.
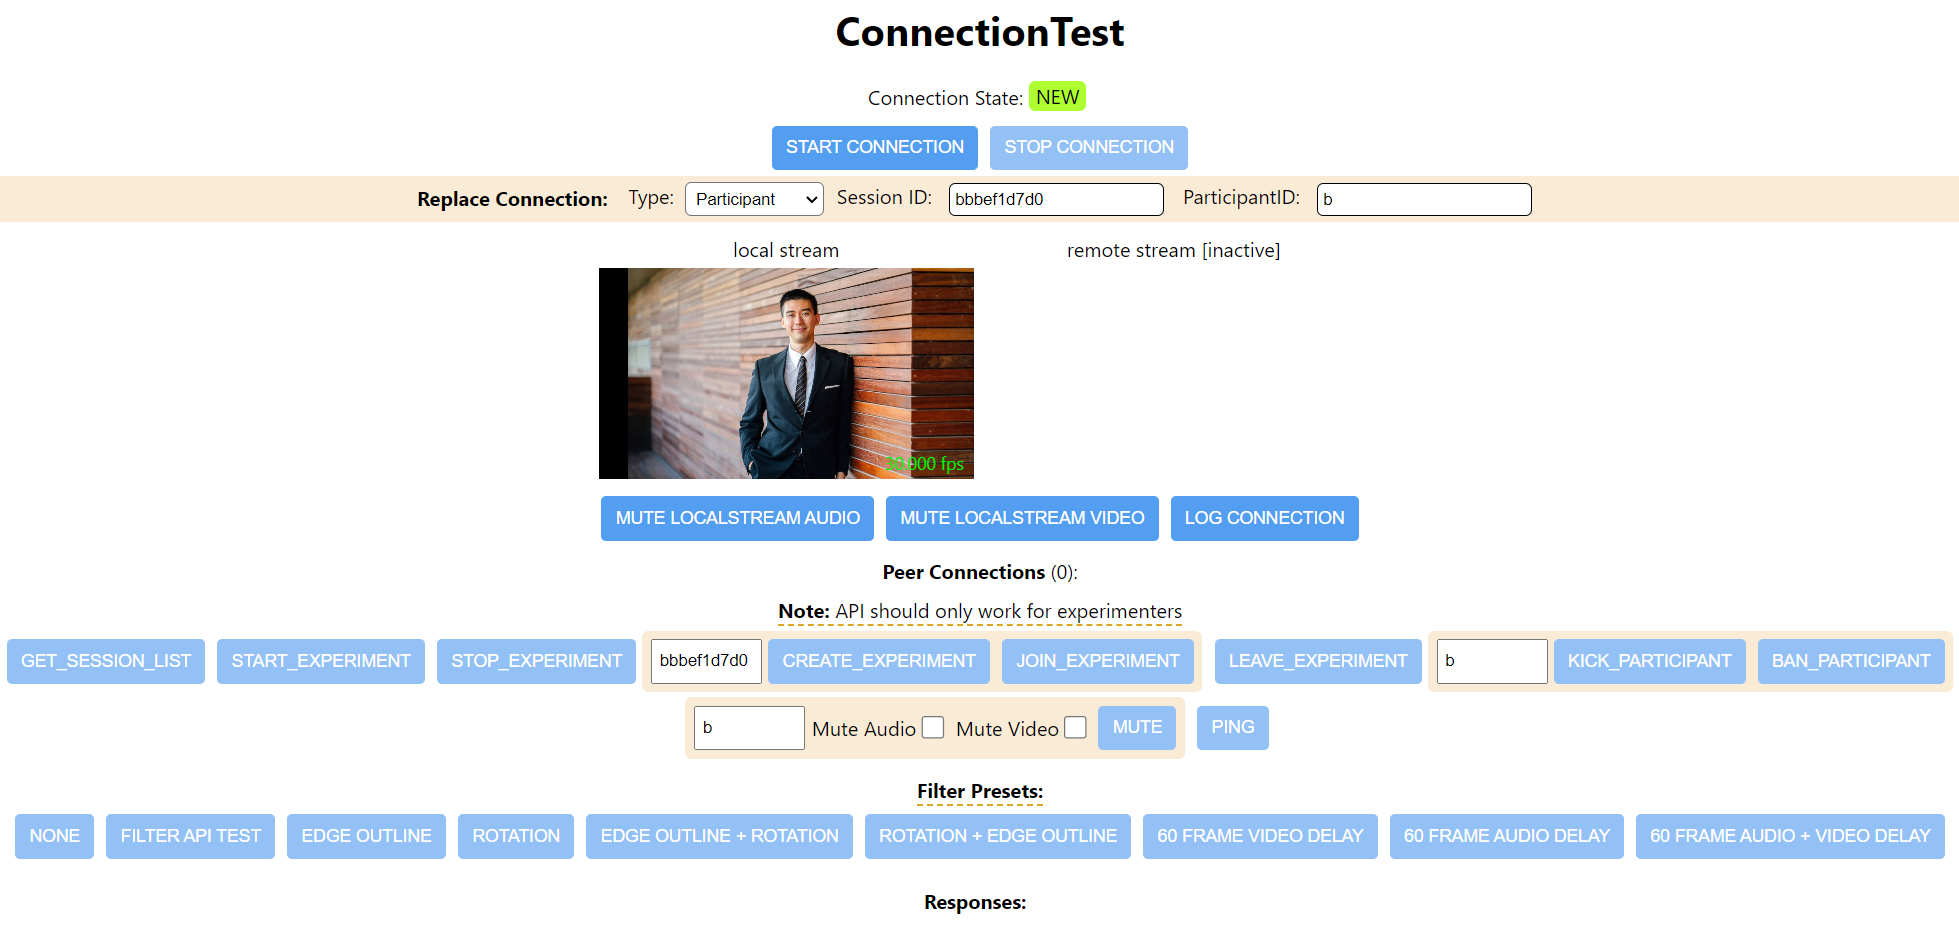
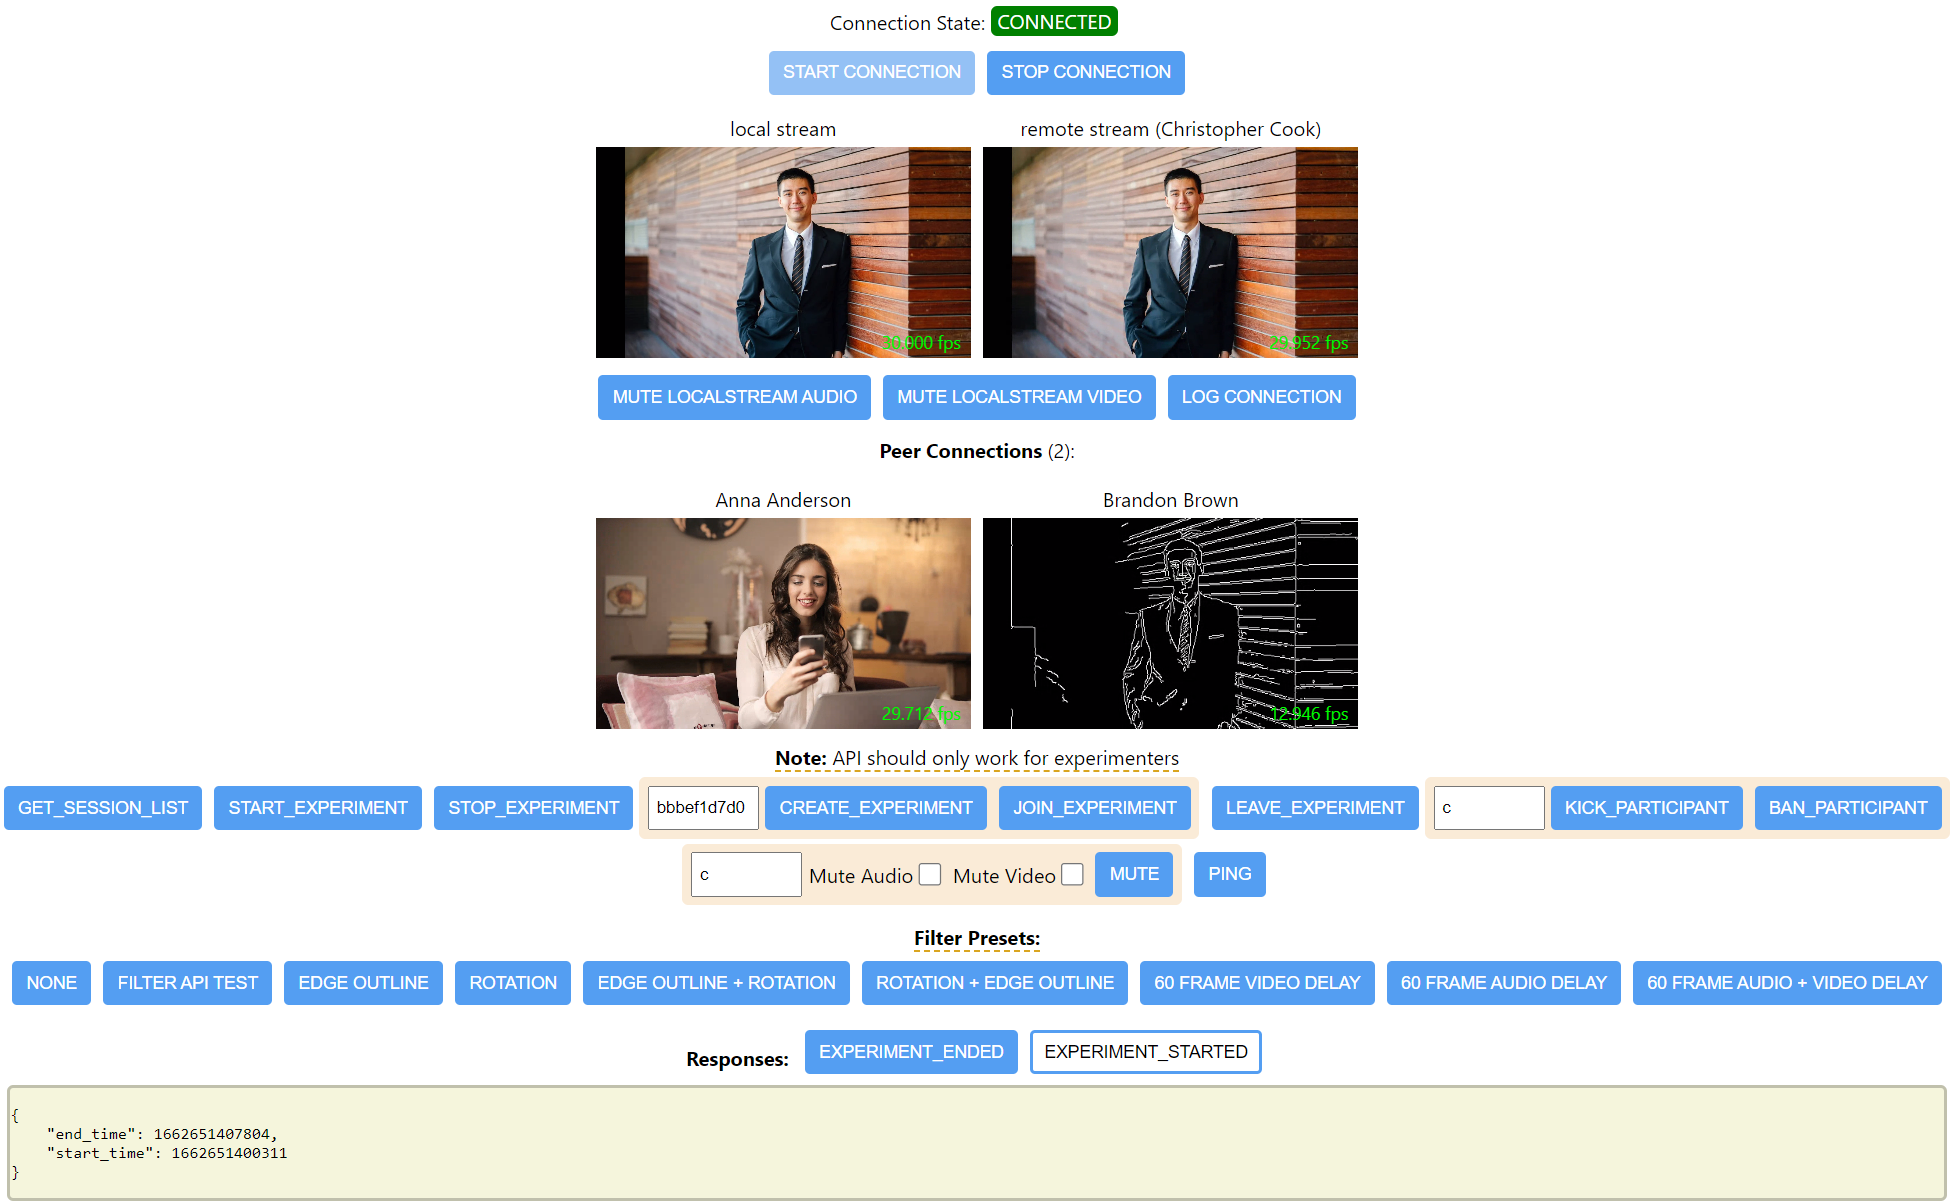
General Connection Test Tool
This tool served as a general testing frontend to test different aspects of the backend. First of all different user
types, password or session and participant IDs can be used to connect as different users. After connecting to the
sever the tool displays and sends a local steam, which is a local webcam & microphone track, and receives it
back from the server (remote stream). The remote stream is what users in the final frontend will see, since the
server applied filters to it. A selection of API endpoints and filter presets can then be used.


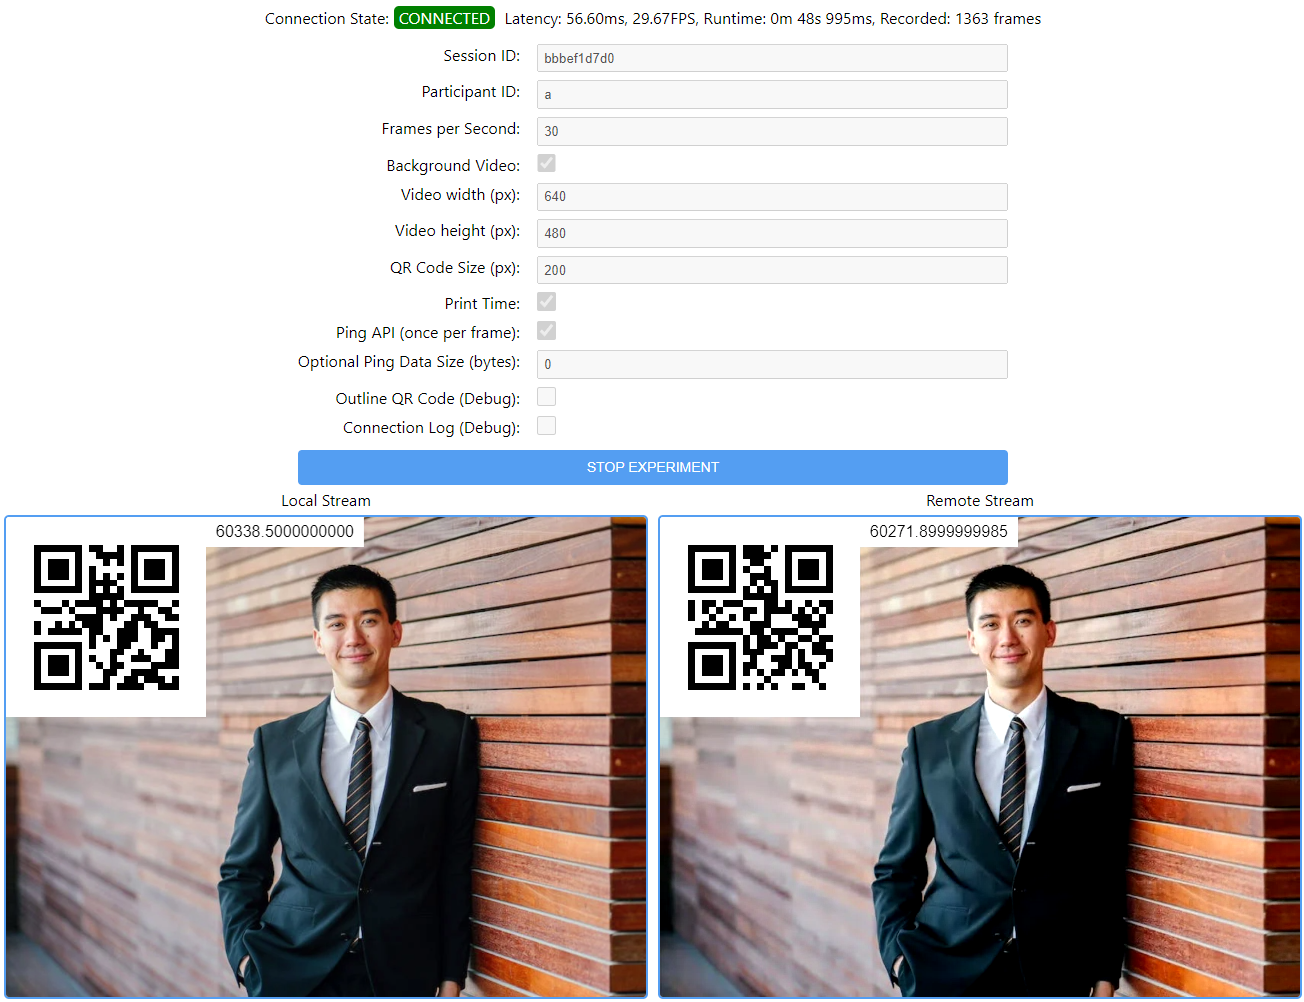
End-to-End Video Latency & API Latency Test Tool
The second tool allows the measurement of end-to-end video latency and API latency. To measure the video latency, a
QR-Code containing a timestamp is attached to each frame before it is sent to the backend. Then, when the tool
receives a frame back, it parses the QR-Code and measures the difference between the time the frame was received and
the time within the QR-Code.
Measuring the API latency is achieved by sending simple PING messages with every frame and measuring the time it
takes until the server sends them back. Additional padding or junk data can be added to the messages to
artificially increase their size.
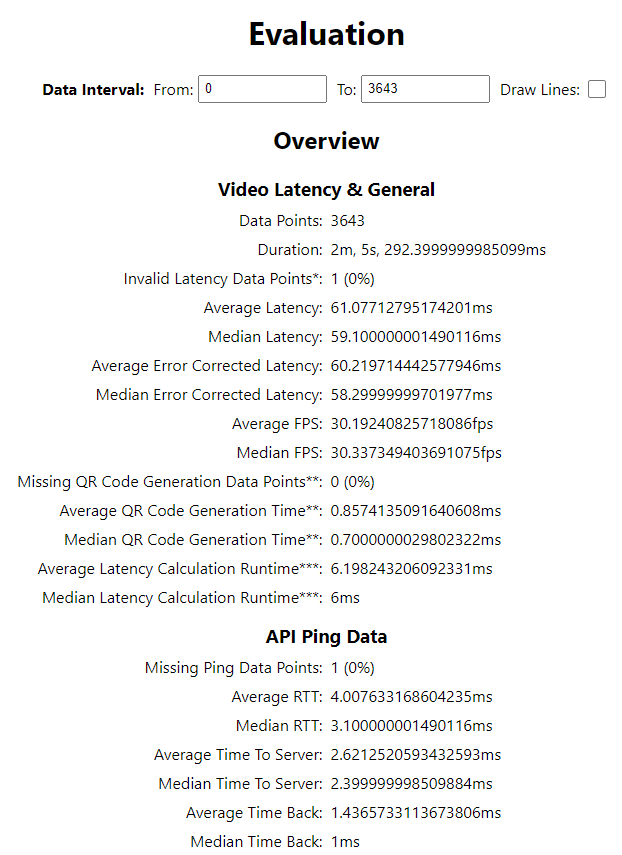
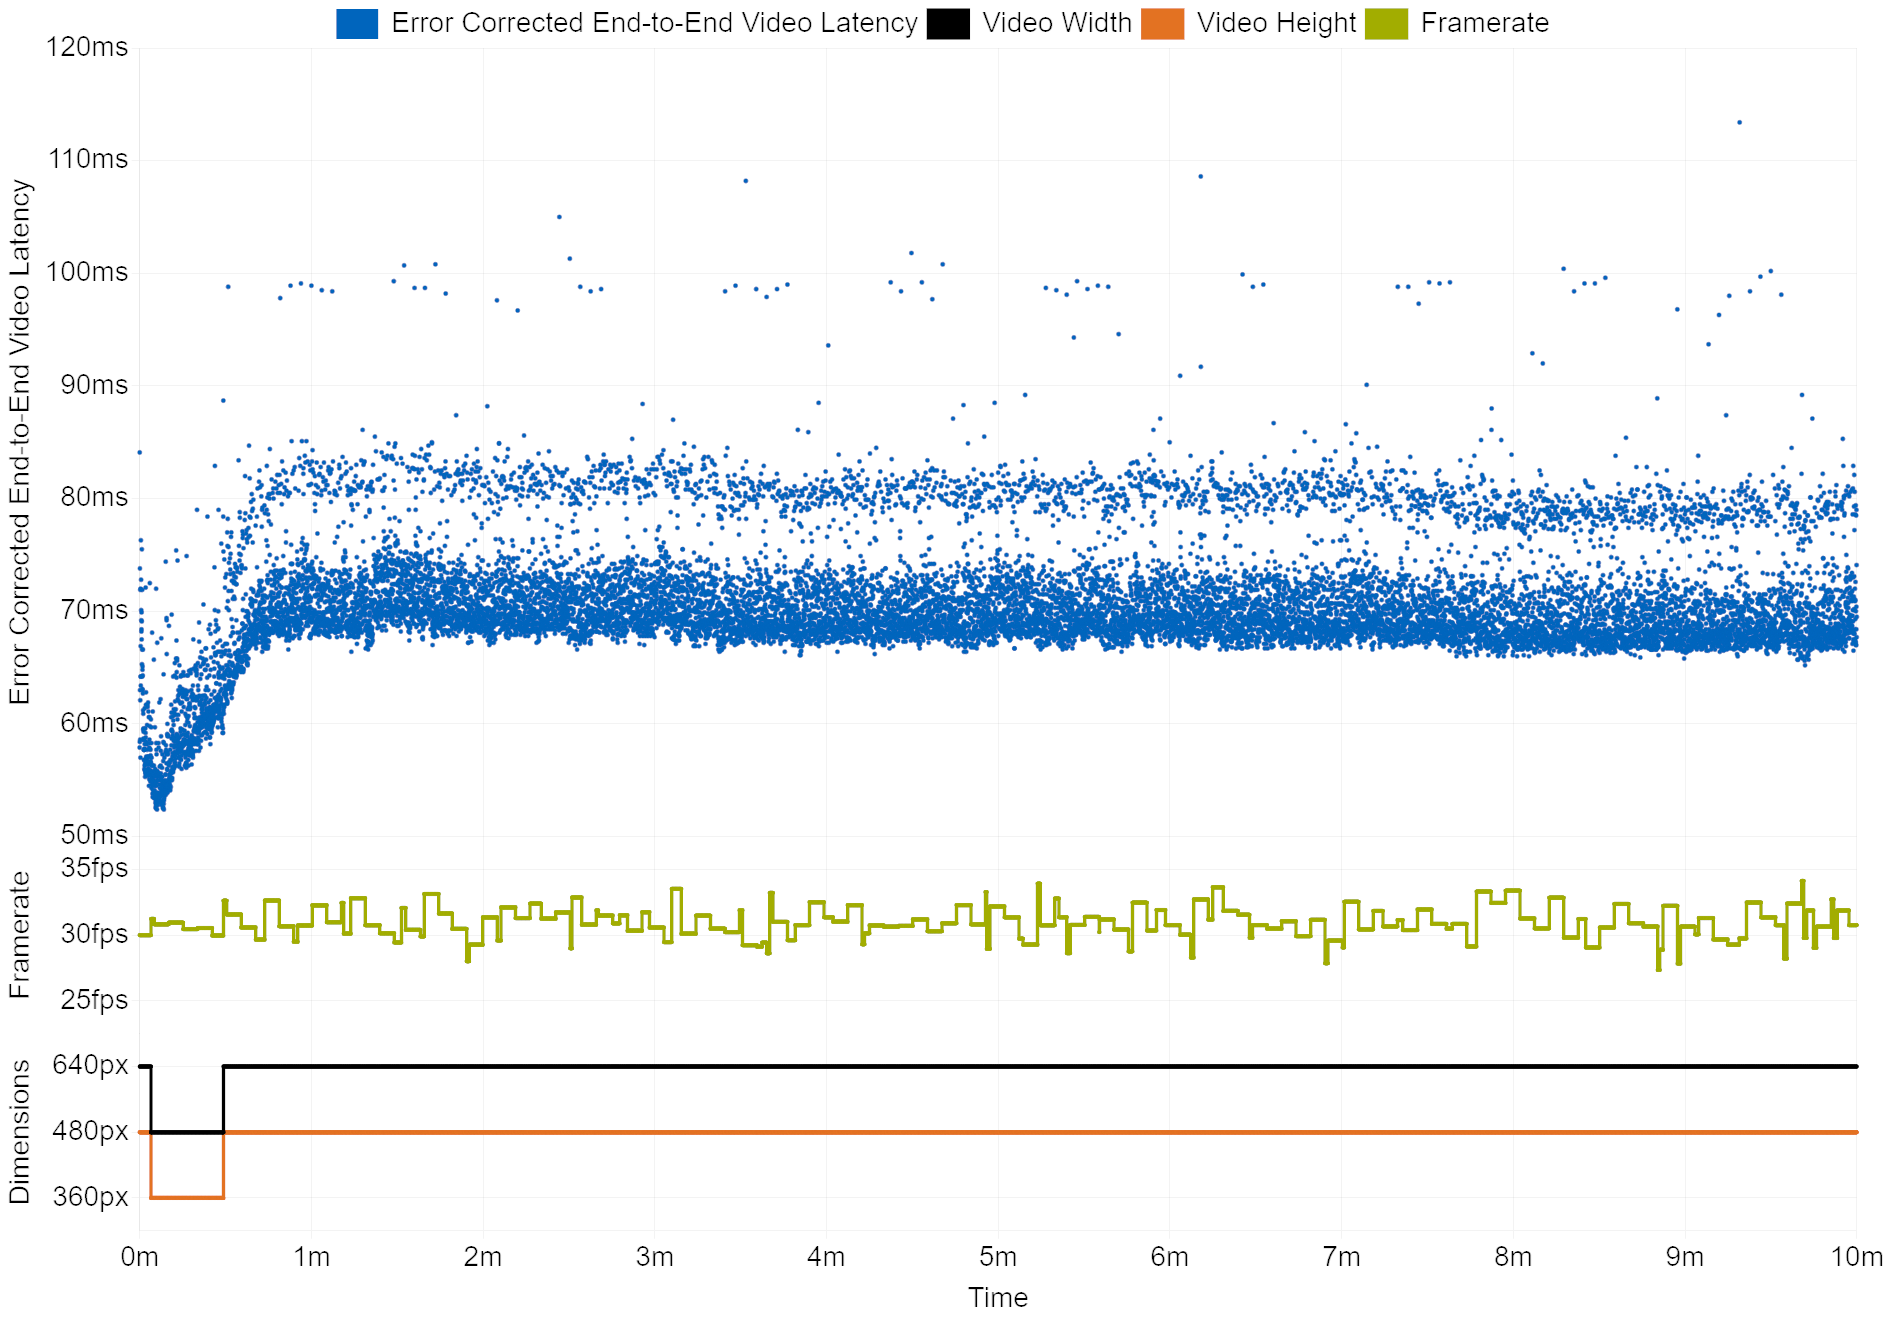
After a measurement was conducted, the tool calculates an overview over the test. This incudes information about the
end-to-end video latency, API latency, framerate, QR-Code generation & parsing times and other useful
statistics. Latency over time and other statistics are also visualized in graphs made with Chart.js.